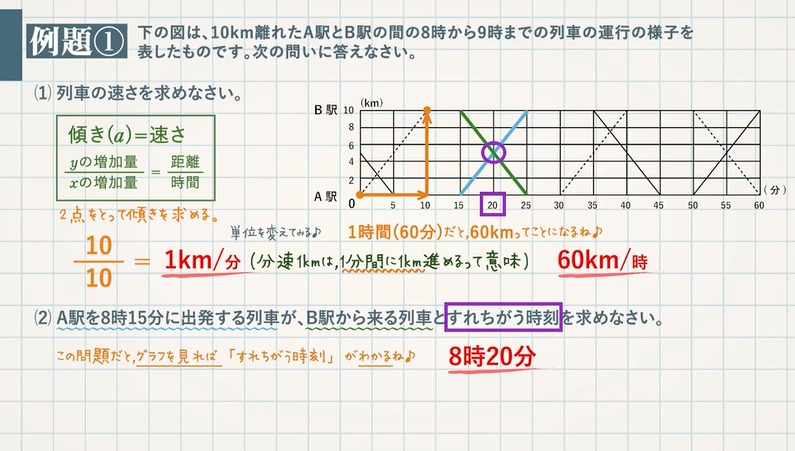
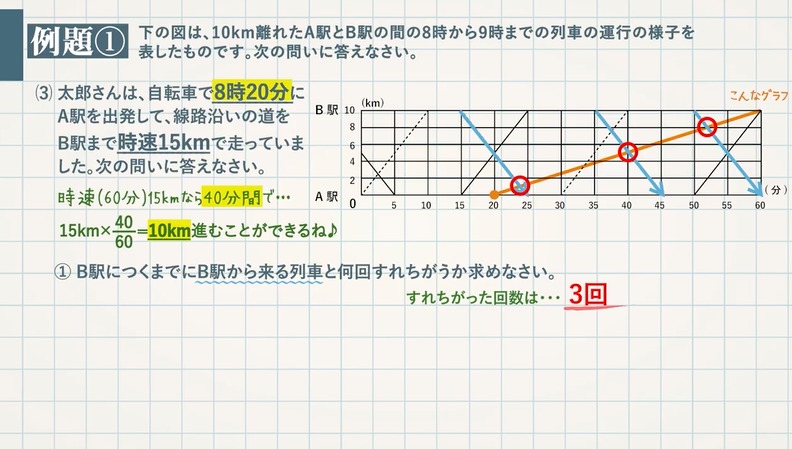
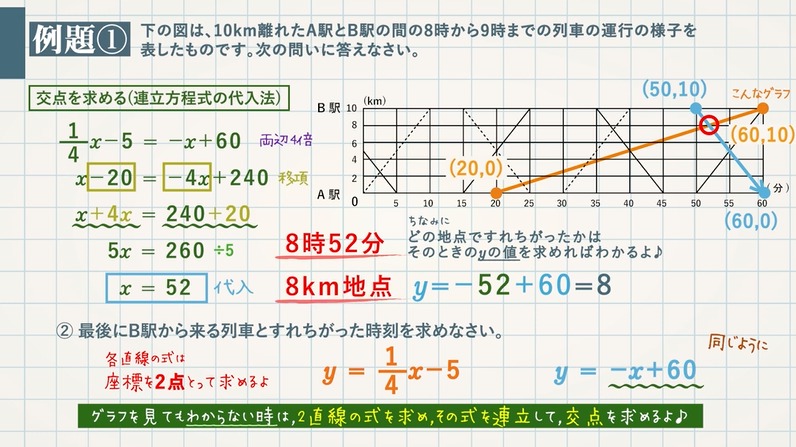
【例題①】図は、$\textcolor{green}{10\rm km}$ 離れたA駅とB駅の間の $\textcolor{green}{8}$ 時から $\textcolor{green}{9}$ 時までの列車の運行の様子を表したものです。次の問いに答えなさい。
(1) 列車の速さを求めなさい。
\begin{eqnarray} & &\textcolor{blue}{傾き(a)}&\textcolor{blue}{=}&\textcolor{blue}{速さ}\\ & &\textcolor{blue}{\frac{y の増加量}{x の増加量}}&\textcolor{blue}{=}&\textcolor{blue}{\frac{距離}{時間}} \end{eqnarray}
$10$ 分で $10$ km 進むので、その速さは $\frac{10}{10}=\textcolor{Red}{1}$ km/分
分速 $1$ km を 時速に変えると、$1$ 時間($60$ 分)なので、$\textcolor{red}{60}$ km/時
(2) A駅を $\textcolor{green}{8}$ 時 $\textcolor{green}{15}$ 分に出発する列車が、B駅から来る列車とすれちがう時刻を求めなさい。
「すれちがう時刻」→ $\textcolor{blue}{2}$ 直線の交点を求める。(この問題の場合はグラフを見ればわかります。) $\textcolor{red}{8}$ 時 $\textcolor{red}{20}$ 分


